https://public.tableau.com/en-us/s/resources
https://public.tableau.com/app/discover/viz-of-the-day
Build your data visualization toolkit
There are many different tools you can use for data visualization.
You can use the visualizations tools in your spreadsheet to create simple visualizations such as line and bar charts.
You can use more advanced tools such as Tableau that allow you to integrate data into dashboard-style visualizations.
If you’re working with the programming language R you can use the visualization tools in RStudio.
Your choice of visualization will be driven by a variety of drivers including the size of your data, the process you used for analyzing your data (spreadsheet, or databases/queries, or programming languages). For now, just consider the basics.
Spreadsheets (Microsoft Excel or Google Sheets)
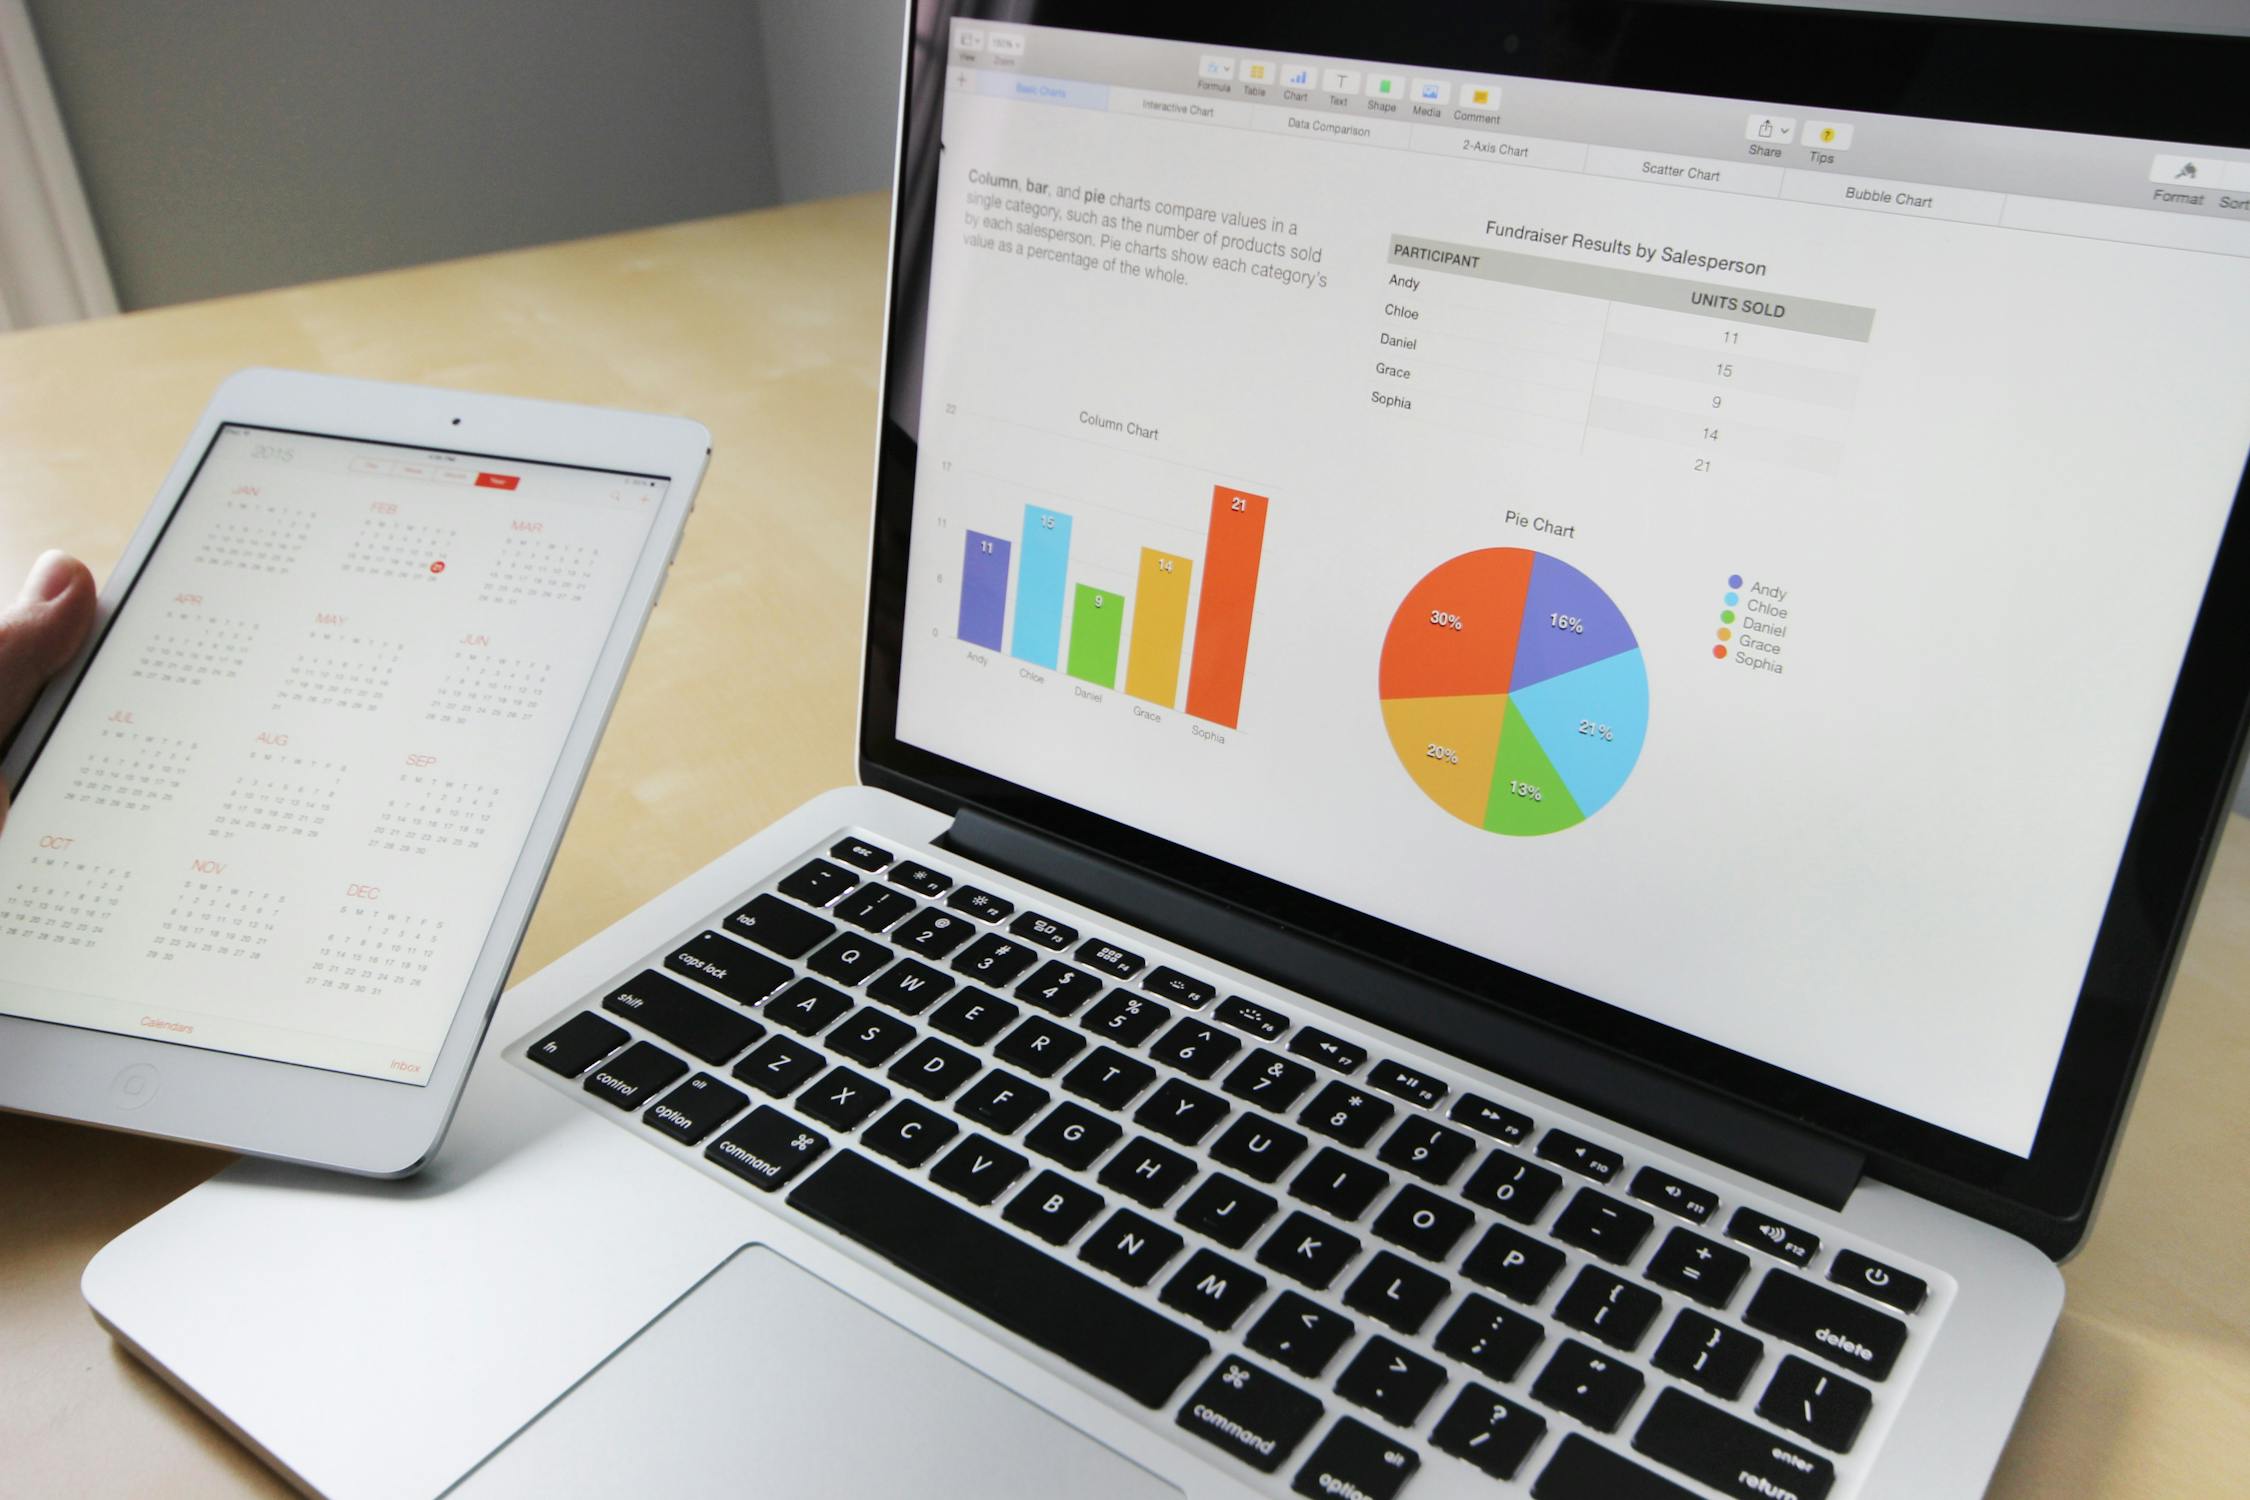
In our example, the built-in charts and graphs in spreadsheets made the process of creating visuals quick and easy. Spreadsheets are great for creating simple visualizations like bar graphs and pie charts, and even provide some advanced visualizations like maps, and waterfall and funnel diagrams (shown in the following figures).
But sometimes you need a more powerful tool to truly bring your data to life. Tableau and RStudio are two examples of widely used platforms that can help you plan, create, and present effective and compelling data visualizations.
Visualization software (Tableau)
Tableau is a popular data visualization tool that lets you pull data from nearly any system and turn it into compelling visuals or actionable insights. The platform offers built-in visual best practices, which makes analyzing and sharing data fast, easy, and (most importantly) useful. Tableau works well with a wide variety of data and includes an interactive dashboard that lets you and your stakeholders click to explore the data interactively.

You can start exploring Tableau from the How-to Video resources. Tableau Public is free, easy to use, and full of helpful information. The Resources page is a one-stop-shop for how-to videos, examples, and datasets for you to practice with. To explore what other data analysts are sharing on Tableau, visit the Viz of the Day page where you will find beautiful visuals ranging from the Hunt for (Habitable) Planets to Who’s Talking in Popular Films.
Programming language (R with RStudio)
A lot of data analysts work with a programming language called R. Most people who work with R end up also using RStudio, an integrated developer environment (IDE), for their data visualization needs. As with Tableau, you can create dashboard-style data visualizations using RStudio.

Check out their website to learn more about RStudio.
You could easily spend days exploring all the resources provided at RStudio.com, but the RStudio Cheatsheets and the RStudio Visualize Data Primer are great places to start. When you have more time, check out the webinars and videos which offer advice and helpful perspectives for both beginners and advanced users.


Comments
Post a Comment